
Zoho Analytics · Accounting Reports · Business Intelligence · Custom Reports · Data Analysis · Finance Reporting · Query Tables · Sales Dashboards · Sales Reporting · SQL · SQL in Zoho Analytics · Zoho Analytics · Zoho Analytics SQL Tutorial · Zoho Analytics Tutorial · Zoho Books · Zoho Books Custom Reports · Zoho Books Dashboard · Zoho Books Reporting · Zoho Partner
Zoho Books Reports in Zoho Analytics: Setup Guide
Learn how to connect Zoho Books to Zoho Analytics, check your data, and build finance reports and dashboards your team can trust.
Zoho Books Reports in Zoho Analytics: Setup Guide
Zoho Books gives finance teams solid built-in reports. But as the business grows, the questions get harder. How does cash flow compare with last year by customer segment? Which overdue invoices belong to your biggest sales accounts? Can leadership see all of it on one screen without waiting for a month-end export? This guide covers the Zoho Books Zoho Analytics setup from start to finish, so you can answer those questions with live, shareable reports.
You will learn when to use each tool, how to connect your data, which reports are worth building first, and how to keep the numbers trustworthy.
> Quick answer / key takeaways
Zoho Books handles day-to-day accounting reports. Zoho Analytics adds deeper analysis, custom calculations, multi-source dashboards and flexible sharing.
Setup follows a simple path: connect Zoho Books, choose the data you need, set a sync schedule, check the numbers, then build reports and dashboards.
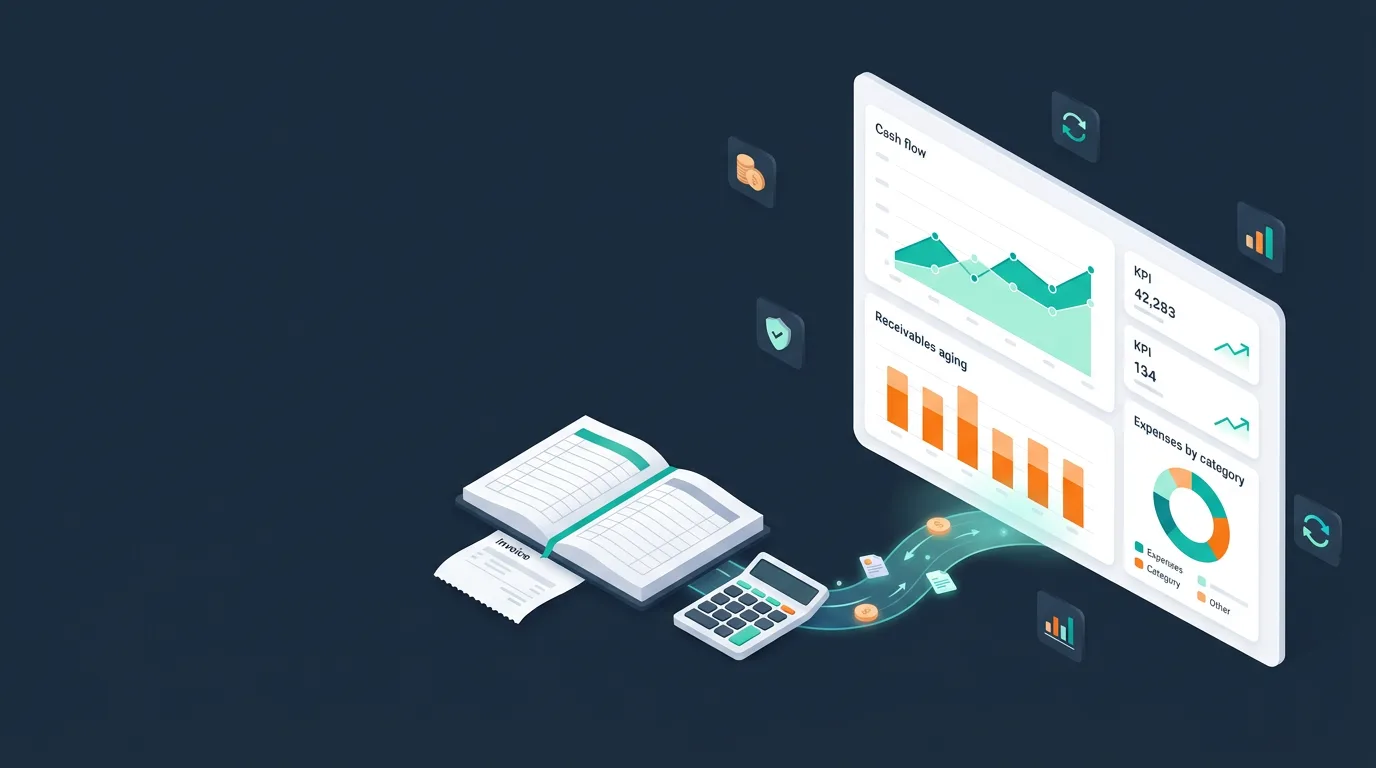
Start with a handful of high-value reports: cash flow, receivables aging, revenue by customer and expenses by category.
Always reconcile your first Analytics reports against the matching Zoho Books reports before sharing them.
Limit access carefully. Financial data should only reach the people who need it.
Zoho Books reporting vs. Zoho Analytics: what's the difference?
Zoho Books reporting is built for accounting work. You get standard financial statements, receivables and payables views, sales and expense reports, tax reports and more, all inside the same product where you record transactions. Zoho Books also lets you customize reports, which is often enough for routine needs.
Zoho Analytics is Zoho's business intelligence tool. It reads your Zoho Books data and lets you analyze it in ways an accounting module isn't designed for:
Build a Zoho Books dashboard that mixes charts, KPIs and tables on one page.
Combine Books data with Zoho CRM, spreadsheets, databases or other sources.
Create calculated fields and custom logic for your own metrics.
Share live views with managers and owners without giving them accounting access.
Most teams use both. Use Zoho Books for transactions and statutory reports, and Zoho Analytics for management reporting and analysis.
What you need before you start
A little preparation makes the setup smoother:
Access to both products. You need a Zoho Books organization and a Zoho Analytics account, using logins that can authorize the connection.
Clean source data. Check that customers, items, accounts and categories are named consistently in Zoho Books.
A list of questions. Write down what your finance team and leadership actually want to see. Each question can become a report.
A reconciliation source. Pick two or three trusted Zoho Books reports, such as profit and loss or receivables aging, to compare against later.
Zoho Books Zoho Analytics setup: step by step
Step 1: Start the connection
In Zoho Analytics, create a new workspace and choose Zoho Books as the data source. The exact menu labels can change, so follow the options shown in your current interface.
Step 2: Authorize access and choose your data
Sign in to authorize Zoho Analytics to read from your Zoho Books organization. If you manage more than one organization, select the right one. Then choose the data you want to bring in, such as invoices, bills, payments, customers, vendors and expenses.
Be selective. Bringing in only what you need keeps the workspace faster and easier to maintain.
Step 3: Set the sync schedule
Choose how often Zoho Analytics should refresh data from Zoho Books. Daily is enough for many management reports. If your team reviews collections or cash position more often, check which refresh frequencies your plan supports and pick the closest fit.
Step 4: Check the data before you build
Before creating any charts, compare a few numbers against Zoho Books:
Total invoiced for a recent month
Outstanding receivables at a specific date
Total expenses for a chosen category
If the figures match, you can build with confidence. If they don't, look at date filters, currencies, voided or draft records and the sync status before going further.
Step 5: Build your first reports
Create one report per question. Zoho Analytics supports chart, pivot, summary and tabular views, plus KPI widgets, so pick the simplest format that answers the question. Start with the reports in the next section.
Step 6: Assemble a dashboard
Group related reports into a single dashboard. Put headline numbers, such as cash position, overdue receivables and monthly revenue, in KPI widgets at the top. Place trend charts in the middle and detailed tables at the bottom. Add filters for date range, customer and currency so one dashboard can serve several audiences.
Step 7: Share it safely
Share dashboards only with the people who need them. Owners may need the full view, while a department head may only need their own expense lines. Check the sharing and permission options in Zoho Analytics before you publish, and review them after any team change.
Finance reports worth building first
These reports cover most of what finance teams and owners ask for, and they make a practical set of Zoho Books custom reports to begin with.
| Report | What it answers | Suggested view |
|---|---|---|
| Cash flow trend | Is cash coming in faster than it goes out? | Line or column chart by month |
| Receivables aging | Who owes us, and for how long? | Stacked bar by age bucket |
| Revenue by customer | Which customers drive income? | Bar chart, top customers |
| Expenses by category | Where is money going? | Bar or pie by category |
| Profit trend | Are margins improving? | Line chart by month |
| Overdue invoices | What needs a follow-up today? | Table sorted by days overdue |
| Payables due | Which bills are coming due? | Table by due date |
If you also connect Zoho CRM, you can go further and compare booked revenue with invoiced revenue, or see open deals alongside a customer's payment history.
Tips for accurate finance reporting
Reconcile first, share second. Match each new report to a trusted Zoho Books report before anyone relies on it.
Watch currencies. If you invoice in more than one currency, decide whether reports show original currency, base currency or both, and label them clearly.
Match your fiscal year. Make sure date logic follows your organization's fiscal calendar, not just the calendar year.
Define terms once. Agree what "revenue," "overdue" and "net profit" mean, then use the same definition everywhere.
Document changes. Note who changed a calculation and why, so month-to-month comparisons stay consistent.
Review access regularly. Remove people who no longer need the data.
Common problems and quick fixes
| Problem | Likely cause | What to try |
|---|---|---|
| Totals don't match Zoho Books | Date range, currency or record status differs | Compare filters and include or exclude drafts and voids to match |
| Data looks out of date | Sync hasn't run recently | Check the sync schedule and run a manual sync |
| A new field is missing | It wasn't selected during setup | Edit the data sources and add the field |
| Dashboard is slow | Too many widgets or too much data | Reduce widgets, filter by period or bring in fewer fields |
FAQ
Do I need Zoho Analytics if I already use Zoho Books reports?
Not necessarily. Zoho Books reports cover standard accounting needs well. Zoho Analytics becomes useful when you want custom dashboards, multi-source analysis, flexible calculations or easier sharing with non-accounting users.
Can I combine Zoho Books data with Zoho CRM data?
Yes, once both sources are in Zoho Analytics you can build reports across them. That lets you compare sales activity with invoicing and payments in one place.
Is the data in Zoho Analytics live?
It is refreshed on a schedule rather than being a direct, instant view. How often it updates depends on your sync settings and plan, so confirm the options available to you.
Can I control who sees financial dashboards?
Yes. Zoho Analytics lets you share reports and dashboards with chosen users. Review the available permission options and test them with a sample user before sharing sensitive financial data.
Need help with Zoho Books reporting in Zoho Analytics?
Cee Apps is a Zoho services partner that helps teams get more from their Zoho data. If you would rather have specialists set up your finance reporting, our Zoho Analytics services include:
Dashboard and report design: clear finance views for accountants, managers and owners.
Data modeling and SQL query tables: custom logic for metrics that standard reports can't produce.
Data integration: connecting Zoho CRM, Zoho Books and third-party sources in one place.
Migrations from other BI tools: moving your existing reports and dashboards into Zoho Analytics.
Training and support: helping your finance team build, maintain and extend their own reports.
Ready to turn your Zoho Books data into reporting your team can trust?
Book a Meeting
Related articles
How to Create SQL Queries in Zoho Analytics
Learn how to write SQL in Zoho Analytics using Query Tables: create, join and aggregate data, avoid common errors and build reusable reports.
Zoho CRM Analytics: How to Build a Sales Dashboard
Learn how to build a Zoho CRM sales dashboard: pick the right KPIs, connect Zoho Analytics, design pipeline reports and share them with your team.
Comments
No comments yet.